$THEME Performance by Company Size ($FIRST - $LAST)
Distribution of $THEME scores by size in $LAST
In this graph, the outer ring represents the proportion of companies in each size in the selected year (every company for that selected year). Whereas the inner ring represents the proportions by size of companies scoring over 65 in the selected theme and year.
Distribution of companies who have $THEME score over 65 by size
Regional $THEME Performance ($BUTTON1)
Distribution of average $THEME score by country in $LAST (with at least 30 assessments in $LAST)
Distribution of average $THEME score by country in $LAST (with at least 100 assessments in $LAST)
Regional Performance Distribution of Companies on the $THEME Theme
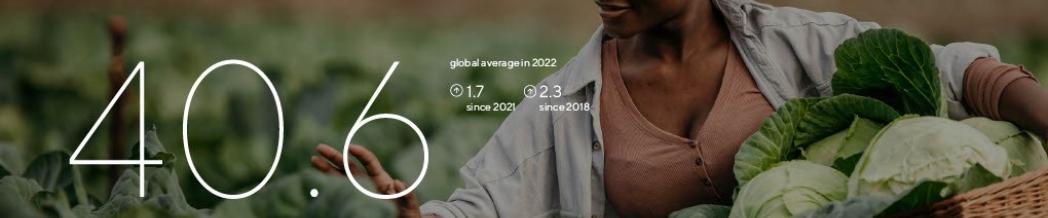
Evolution of $THEME Scoring ($FIRST-$LAST)
Industry Scoring on the $THEME Theme ($BUTTON1)
$THEME Performance Improvement by Industry ($COMPAREYEAR - $CURRENTYEAR)
Industry Comparison: SMEs vs. Large Companies on the $THEME Theme ($FIRST-$LAST)
Table : Industry Comparison: SMEs vs. Large Companies on the $THEME Theme ($FIRST-$LAST)
Performance Distribution of Companies on the $THEME Theme
On this graph, for first assessment we take ALL firms who did their first assessment in $LAST (only).
And for 2 or more assessments, we only take firms who were assessed in $LAST and were assessed at least once before.
$THEME Performance By Number of Assessments ($LAST)
Score level for theme for first assessment vs 2+ assessments in $LAST
Regional Distribution of Companies Across the EcoVadis Performance Levels in Europe (100+ assessments only)
Number of companies by number of criteria for $THEME in $FIRST and $LAST
Most Common Actions Taken By Companies To Address $THEME Issues in $YEAR
Most Common Actions Taken By Companies To Address $THEME Issues in $YEAR (by company size) in $SCALE
Biggest actions Sustainable Procurement in $LAST
Biggest actions Sustainable Procurement in $LAST
Sustainable Procurement actions by size in $LAST