Themes
Welcome to the "THEME" exploration
Please add in comments any questions, graph needed for this section analysis < mid APRIL 2024
Theme selection
Table that shows countries in the world in $LAST (with at least 30 assessments) for $THEME
Distribution of average $THEME score by country in $LAST (with at least 30 assessments in $LAST)
Distribution of average $THEME score by country in $LAST (with at least 100 assessments in $LAST)
Average $THEME score over the years
BoxPlot for $THEME over the years
Average $THEME score over the years for first assessment only
On this graph, for first assessment we take ALL firms who did their first assessment in $FIRST or $LAST.
And for 2 or more assessments, we only take firms who were assessed in $LAST and were assessed at least once before. Since our starting point is $FIRST, every assessment in that year is first assessment and that's why we don't have data for 2 or more assessments in $FIRST.
Comparaison of $THEME average scores by number of assessments
On this graph, for first assessment we take ALL firms who did their first assessment in $LAST (only).
And for 2 or more assessments, we only take firms who were assessed in $LAST and were assessed at least once before.
$THEME Performance By Number of Assessments ($LAST)
For first assessment, we have every firms' first assessment during our period.
For 2 or more assessments, we only have firms who did at least 2 assessments during our period and one of them is in $LAST. The other years are the average of those firms on their first assessment if it was in $MINUS or $BEFORE.
Comparaison of $THEME average scores, firms with only 1 assessment vs firms with more than one assessment
Average $THEME score by number of assessments
Evolution of $THEME Scoring ($FIRST-$LAST)
For each firm which did at least 2 assessments during our period, you can read :
- vertically : the score category of their first assessment
- horizontally : the score category of their last assessment
Every firm in the diagonal stayed in the same score category in their first and last assessment. Firms below the diagonal dropped to a lower score category during their last assessment, and firms above the diagonal upgraded their score category during their last assessment.
Comparaison of scores during the first and last assessment between $FIRST and $LAST
Table of data for first and last assessment on EV scale
Score level for $THEME for first/last assessment
Score level for $THEME for first/last assessment
Score level for $THEME for first and second assessment
Comparaison of scores during the first and last eval between $FIRST and $LAST 10-scale
Industry Scoring on the $THEME Theme ($BUTTON1)
Distribution of average $THEME score by sub-industry in $LAST

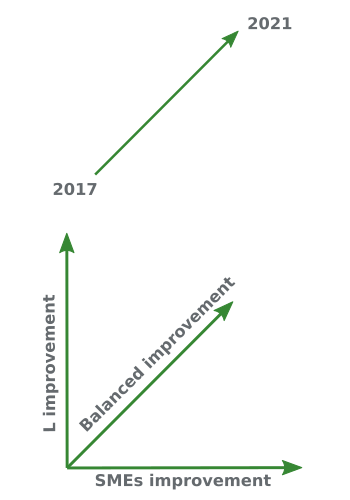
Industry Comparison: SMEs vs. Large Companies on the $THEME Theme ($FIRST-$LAST)
Average scores in their first and second or more assessment for $THEME
Distribution of $THEME scores in $BUTTON2
Distribution of $THEME scores for $BUTTON1 firms
Distribution of $THEME scores by size in $LAST
Number of firms who have $THEME score over 65 in $LAST
Number of companies who have $THEME score over 65 in $LAST
In this graph, the outer ring represents the proportion of companies in each size in the selected year (every company for that selected year). Whereas the inner ring represents the proportions by size of companies scoring over 65 in the selected theme and year.
Distribution of companies who have $THEME score over 65 by size
Table for firms with score over 65 in $LAST by size
Table for firms with score over 65 in $LAST by region
Table for firms with score over 65 in $LAST by industry
$THEME score of firms with evaluations in $FIRST and $LAST ($TOTAL)
Number of companies by number of criteria for $THEME (WIP, all data integrated, waiting for datacheck)
Number of companies by number of criteria for $THEME to $BUTTON3 by year (WIP, all data integrated, waiting for datacheck)
Number of companies by number of criteria for $THEME in $FIRST and $LAST
DESIGN : verify with writers the criteria and level to be promoted (all filters active)
Most used strength's SIAs for $THEME
Most used strength's SIAs for $THEME for $BUTTON2 in $BUTTON1 (only Measures)
DESIGN : verify with writers the criteria and level to be promoted (all filters active)
Most used improvement area's SIAs for $THEME
Most used improvement area's SIAs for $THEME for $BUTTON2 in $BUTTON1 (only Measures)